Simulation initialisation and run
[1]:
import context
[2]:
%matplotlib inline
%load_ext autoreload
%autoreload 2
[3]:
from RiverNetworkCase import RiverNetwork
import pandas as pd
import time
[4]:
river_data = 'data_gloric/padma_gloric_1m3_final_no_geo.pkl'
watersheds_data = 'data_gloric/areas_gloric_no_geo.pkl'
rain_data = 'data_pmm/20130616-S000000-E002959-20130617-S233000-E235959.pkl'
result_data = 'data_results/overflow_130616_130617_2.pkl'
[5]:
padma = pd.read_pickle(river_data)
padma = padma.set_index('Reach_ID',drop=False)
padma.head()
[5]:
| Reach_ID | Next_down | Length_km | Log_Q_avg | Log_Q_var | Class_hydr | Temp_min | CMI_indx | Log_elev | Class_phys | Lake_wet | Stream_pow | Class_geom | Reach_type | Kmeans_30 | |
|---|---|---|---|---|---|---|---|---|---|---|---|---|---|---|---|
| Reach_ID | |||||||||||||||
| 40763397 | 40763397 | 40764488 | 6.753 | 0.98529 | 0.60554 | 13 | 16.1 | -0.441 | 2.25768 | 311 | 0 | 0.19790 | 11 | 311 | 4 |
| 40894470 | 40894470 | 40894471 | 1.246 | 0.22194 | 0.35383 | 12 | 16.9 | 0.228 | 2.47712 | 331 | 0 | 0.05036 | 11 | 511 | 11 |
| 40894471 | 40894471 | 40893932 | 1.244 | 0.36154 | 0.35388 | 12 | 17.0 | 0.231 | 2.48287 | 331 | 0 | 0.08349 | 11 | 511 | 11 |
| 40763399 | 40763399 | 40762358 | 2.722 | 0.61847 | 0.60323 | 13 | 16.1 | -0.393 | 2.24055 | 321 | 0 | 0.08569 | 11 | 611 | 4 |
| 40763402 | 40763402 | 40763652 | 1.544 | 3.13560 | 0.48803 | 43 | 16.6 | 0.026 | 2.16732 | 321 | 1 | 0.00000 | 21 | 643 | 24 |
[6]:
start = time.time()
rivernetwork = RiverNetwork(river_data, rain_data, x = 0.2, speed = 2, runoff_coeff = 0.5, t_max = 2*24*60)
end = time.time()
print('Duration: {:.2f}'.format(end - start) + 's')
Duration: 298.56s
[5]:
start = time.time()
rivernetwork.calculate_flows()
end = time.time()
print('Duration: {:.2f}'.format(end - start) + 's')
Duration: 828.75s
[6]:
overflow = rivernetwork.get_overflow()
[7]:
overflow.to_pickle(result_data)
[ ]:
[8]:
import pickle
f = open("data_results/raw_object_130616_130617_2.pkl","wb")
pickle.dump(rivernetwork,f)
f.close()
[ ]:
[ ]:
[9]:
for node_str in rivernetwork.G.nodes:
    node = rivernetwork.G.nodes[node_str]
    if node['source'] == True:
        #print(node);
        break;
[10]:
rivernetwork.plot_node_flows(node_str)
[10]:
(<Figure size 432x288 with 1 Axes>,
 <matplotlib.axes._subplots.AxesSubplot at 0x121773950>)

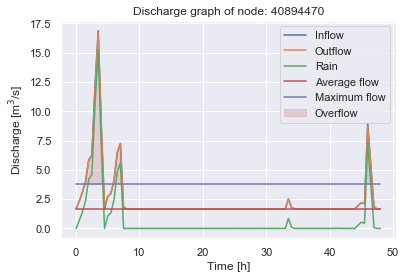
[11]:
rivernetwork.plot_node_flows(node_str)
[11]:
(<Figure size 432x288 with 1 Axes>,
 <matplotlib.axes._subplots.AxesSubplot at 0x1a28397810>)
[12]:
len(rivernetwork.get_node(50000000)['Qout'])
[12]:
97
[13]:
rivernetwork.plot_node_flows(50000000)
[13]:
(<Figure size 432x288 with 1 Axes>,
 <matplotlib.axes._subplots.AxesSubplot at 0x1a37553650>)

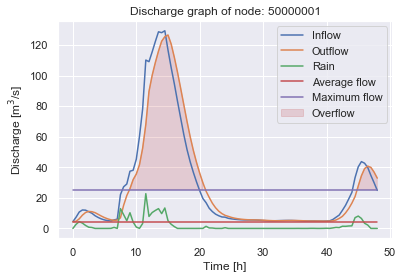
[14]:
rivernetwork.plot_node_flows(50000001)
[14]:
(<Figure size 432x288 with 1 Axes>,
 <matplotlib.axes._subplots.AxesSubplot at 0x1a3f540610>)
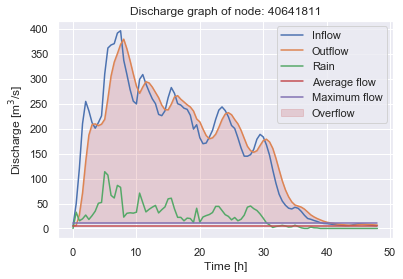
[15]:
rivernetwork.plot_node_flows(40641811)
[15]:
(<Figure size 432x288 with 1 Axes>,
 <matplotlib.axes._subplots.AxesSubplot at 0x1a37faba50>)
[ ]: