Plotting results
Overflow
[1]:
import context
import geopandas as gp
import pandas as pd
[2]:
%load_ext autoreload
%autoreload 2
Loading the files: one with the river geometries, the other with the overflow results
[3]:
river_geo = 'data_gloric/padma_gloric_1m3_final.shp'
result_data = 'data_results/overflow_130616_130617_2.pkl'
river = gp.read_file(river_geo).set_index('Reach_ID')
results = pd.read_pickle(result_data)
Creating a maximum flow by taking the max over the time axis.
[4]:
max_overflow = pd.DataFrame(results.max(axis=1))\
        .rename({0:'max_overflow'},axis=1)\
        .join(river[['geometry']])
max_overflow = gp.GeoDataFrame(max_overflow).reset_index()
max_overflow.crs = {'init':'EPSG:4326'}
max_overflow.head()
[4]:
| Reach_ID | max_overflow | geometry | |
|---|---|---|---|
| 0 | 40633088 | 74.218533 | LINESTRING (79.09374999999974 31.3854166666661... |
| 1 | 40633506 | 114.017808 | LINESTRING (79.0812499999997 31.35624999999951... |
| 2 | 40633927 | 129.560853 | LINESTRING (79.07708333333304 31.3437499999995... |
| 3 | 40634367 | 121.140140 | LINESTRING (77.88958333333304 31.3270833333328... |
| 4 | 40634489 | 111.109322 | LINESTRING (78.00208333333305 31.3229166666661... |
[5]:
from custom_plot import *
[7]:
plot_results_map(max_overflow);

[ ]:
#plot_results_map(max_overflow, figsize = (9.3,6.2) ,printoption = True, filename = '../../thesis/report/figs/result_basin_large_4.pdf');
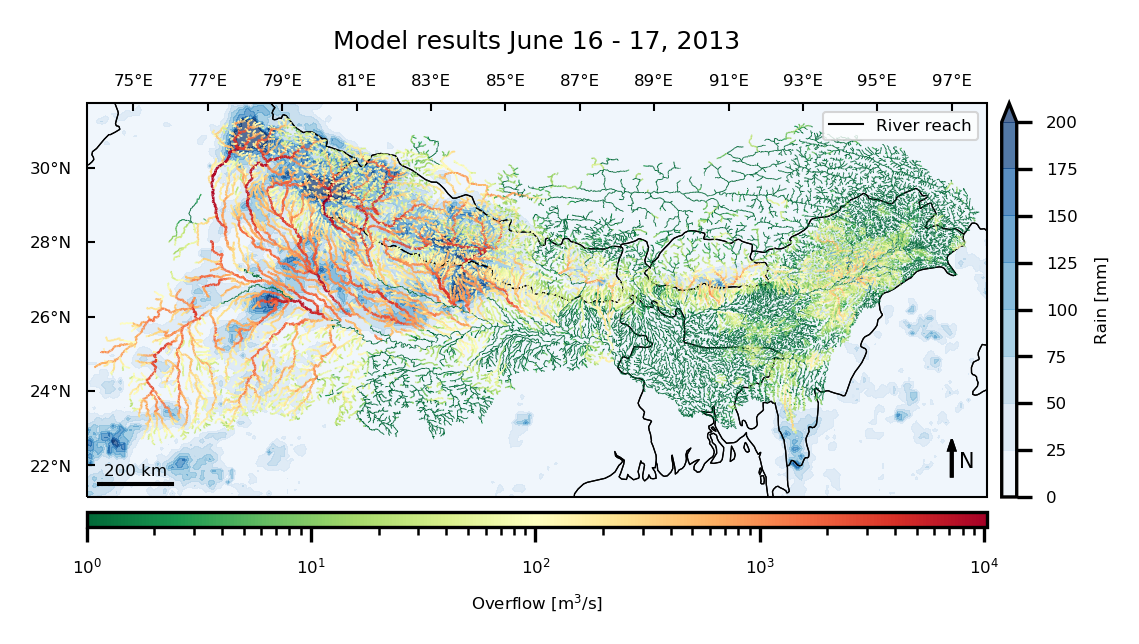
Overflow with rain
We are adding rainfall data agregated over the two days.
[8]:
import helper_functions
import globals
bounds = globals.bounds(0.2)
west, south, east, north = bounds
south -= 1.2
north += 0.2
bounds = west, south, east, north
dates = globals.dates()
filenames = helper_functions.get_hdf_list(dates[2:4])
gpm_data = helper_functions.GPM(filenames[0],bounds)
newLats, newLons = gpm_data.coordinates(bounds)
total_rain = np.zeros(gpm_data.get_crop().shape)
for filename in filenames:
    gpm_data = helper_functions.GPM(filename,bounds)
    #gpm_data.save_cropped_tif()
    total_rain += gpm_data.get_crop()
total_rain = total_rain/2
rain_data = (total_rain, newLats, newLons)
[9]:
plot_results_map_rain(max_overflow,rain_data);
[ ]:
#plot_results_map_rain(max_overflow, rain_data, figsize = (9.3,6.2) ,printoption = True, filename = '../../thesis/report/figs/result_rain_large_2.pdf');