Extract regional dataset from HydroSHEDS
In this notebook the regional dataset is extracted from the HydroSHEDS dataset. The countries combined are: India, Bangladesh, China Xizang, Butan en Nepal.
[ ]:
import geopandas as gp
import pandas as pd
import time
from matplotlib import pyplot as plt
from descartes import PolygonPatch
[2]:
water = gp.read_file('as_riv_15s/as_riv_15s.shp')
#water = water.set_index('ARCID')
Create spatial index
[3]:
start = time.time()
water_index = water.sindex
end = time.time()
print(end - start)
98.75945281982422
Combining regions
[2]:
ind = gp.read_file('adm regions/IND_adm/IND_adm0.shp')
[3]:
bgd = gp.read_file('adm regions/BGD_adm/BGD_adm0.shp')
[4]:
chn = gp.read_file('adm regions/CHN_adm/CHN_adm0.shp')
chnprov = gp.read_file('adm regions/CHN_adm/CHN_adm1.shp')
#chnprov = chnprov[chnprov['NAME_1']=='Xizang' ]
[5]:
btn = gp.read_file('adm regions/BTN_adm/BTN_adm0.shp')
[6]:
npl = gp.read_file('adm regions/NPL_adm/NPL_adm0.shp')
[7]:
chn
[7]:
| ID_0 | ISO | NAME_0 | OBJECTID_1 | ISO3 | NAME_ENGLI | NAME_ISO | NAME_FAO | NAME_LOCAL | NAME_OBSOL | ... | CARICOM | EU | CAN | ACP | Landlocked | AOSIS | SIDS | Islands | LDC | geometry | |
|---|---|---|---|---|---|---|---|---|---|---|---|---|---|---|---|---|---|---|---|---|---|
| 0 | 49 | CHN | China | 45 | CHN | China | CHINA | China | Zhong Guo | None | ... | 0.0 | 0.0 | 0.0 | 0.0 | 0.0 | 0.0 | 0.0 | 0.0 | 0.0 | (POLYGON ((109.6765289306645 18.18708419799833... |
1 rows × 71 columns
[8]:
chn.loc[[0],'geometry'] = chnprov.loc[[28],'geometry'].values
[9]:
regions = pd.concat([ind,bgd,chn,btn,npl])
[10]:
regions.to_file('adm regions/combined.shp')
[12]:
regions_area = regions.convex_hull
[13]:
regions.boundary
[13]:
0    (LINESTRING (93.78772735595709 6.8526401519778...
0    (LINESTRING (92.27416992187494 20.926111221313...
0    (LINESTRING (88.91962432861351 27.322996139526...
0    LINESTRING (89.80424499511724 28.2388420104981...
0    LINESTRING (81.7145156860351 30.41273307800293...
dtype: object
Create single shape:
[14]:
region = regions.unary_union
Finding edges in square region
[15]:
possible_matches_index = list(water_index.intersection(region.bounds))
possible_matches = water.iloc[possible_matches_index]
#precise_matches = possible_matches[possible_matches.intersects(region)]
[16]:
possible_matches.to_file("out/water_in_region_box.shp")
Precise finding edges
First step is to divide the shape into squares.
[17]:
west, south, east, north = region.bounds
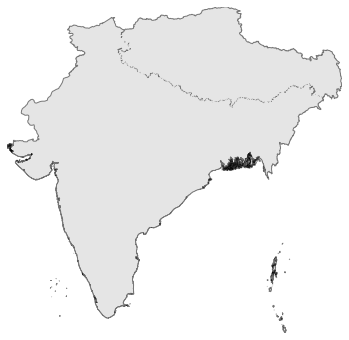
[18]:
fig, ax = plt.subplots(figsize=(6,6))
for polygon in region:
    patch = PolygonPatch(polygon, fc='#cccccc', ec='k', alpha=0.5, zorder=2)
    ax.add_patch(patch)

ax.set_xlim(west, east)
ax.set_ylim(south, north)
ax.axis('off')
plt.show()
[19]:
import osmnx as ox
[20]:
geometry_cut = ox.quadrat_cut_geometry(region, quadrat_width=1)
[21]:
fig, ax = plt.subplots(figsize=(6,6))
for polygon in geometry_cut:
    patch = PolygonPatch(polygon, fc='#cccccc', ec='k', alpha=0.5, zorder=2)
    ax.add_patch(patch)

ax.set_xlim(west, east)
ax.set_ylim(south, north)
ax.axis('off')
plt.show()
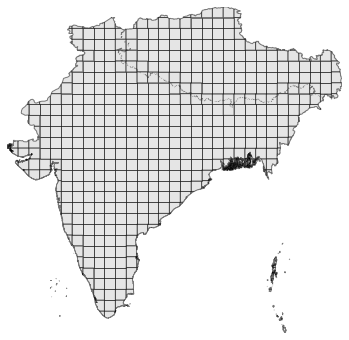
To speed up calculation, first the matches for each square cut are found. Then for each of those matches it is determined if the are in the shapeform.
[22]:
# find the points that intersect with each subpolygon and add them to points_within_geometry
sindex = water_index
points_within_geometry = pd.DataFrame()
i=0
for poly in geometry_cut:
    # buffer by the <1 micron dist to account for any space lost in the quadrat cutting
    # otherwise may miss point(s) that lay directly on quadrat line
    poly = poly.buffer(1e-14).buffer(0)

    # find approximate matches with r-tree, then precise matches from those approximate ones
    possible_matches_index = list(sindex.intersection(poly.bounds))
    possible_matches = water.iloc[possible_matches_index]
    precise_matches = possible_matches[possible_matches.intersects(poly)]
    points_within_geometry = points_within_geometry.append(precise_matches)

    i=i+1
    print("{:.0%}".format(i/len(geometry_cut)),end="\r")
100%
[23]:
points_within_geometry.head()
[23]:
| ARCID | UP_CELLS | geometry | |
|---|---|---|---|
| 623842 | 623843 | 172 | LINESTRING (79.16249999999965 32.1041666666659... |
| 623360 | 623361 | 4207 | LINESTRING (79.15208333333298 32.1354166666659... |
| 623076 | 623077 | 108 | LINESTRING (79.21458333333298 32.1499999999993... |
| 622498 | 622499 | 6122 | LINESTRING (79.19374999999964 32.1895833333326... |
| 622497 | 622498 | 141 | LINESTRING (79.17083333333298 32.1958333333326... |
[24]:
points_within_geometry.shape
[24]:
(137124, 3)
[25]:
# drop duplicate points, if buffered poly caused an overlap on point(s) that lay directly on a quadrat line
points_within_geometry = points_within_geometry.drop_duplicates(subset=['ARCID'])
points_outside_geometry = water[~water.isin(points_within_geometry)]
[26]:
points_within_geometry.shape
[26]:
(128150, 3)
Save the lines within the geometry
[27]:
points_within_geometry.to_file("out/water_in_region.shp")
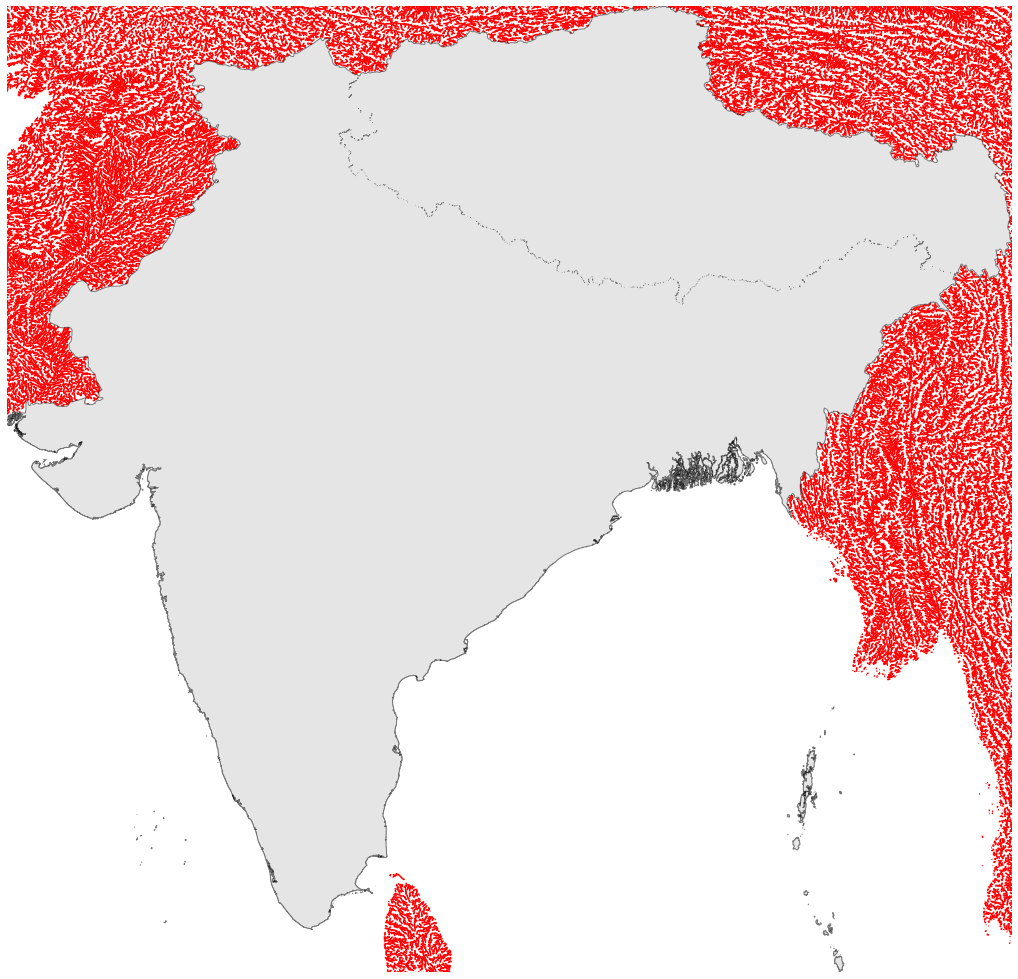
Plot lines within or outside the geometry
[28]:
fig, ax = plt.subplots(1, figsize=(18,18))
for polygon in region:
    patch = PolygonPatch(polygon, fc='#cccccc', ec='k', alpha=0.5, zorder=2)
    ax.add_patch(patch)

#points_within_geometry.plot(ax=ax,color='b')
points_outside_geometry.plot(ax=ax,color='r')

ax.set_xlim(west, east)
ax.set_ylim(south, north)
ax.axis('off')
plt.show()